
Part of our work on retail
Retail Industry
What Inventory Accuracy Actually Costs When It Sits at 92 Percent
Big Sky Consulting Group · September 18, 2026 · 7 min read
The number on the dashboard is an average
Your last count came back at 92 percent. Someone on the leadership team asked whether that is good. Someone else searched the question and found a page telling them it is a disaster, followed by a demo request form.
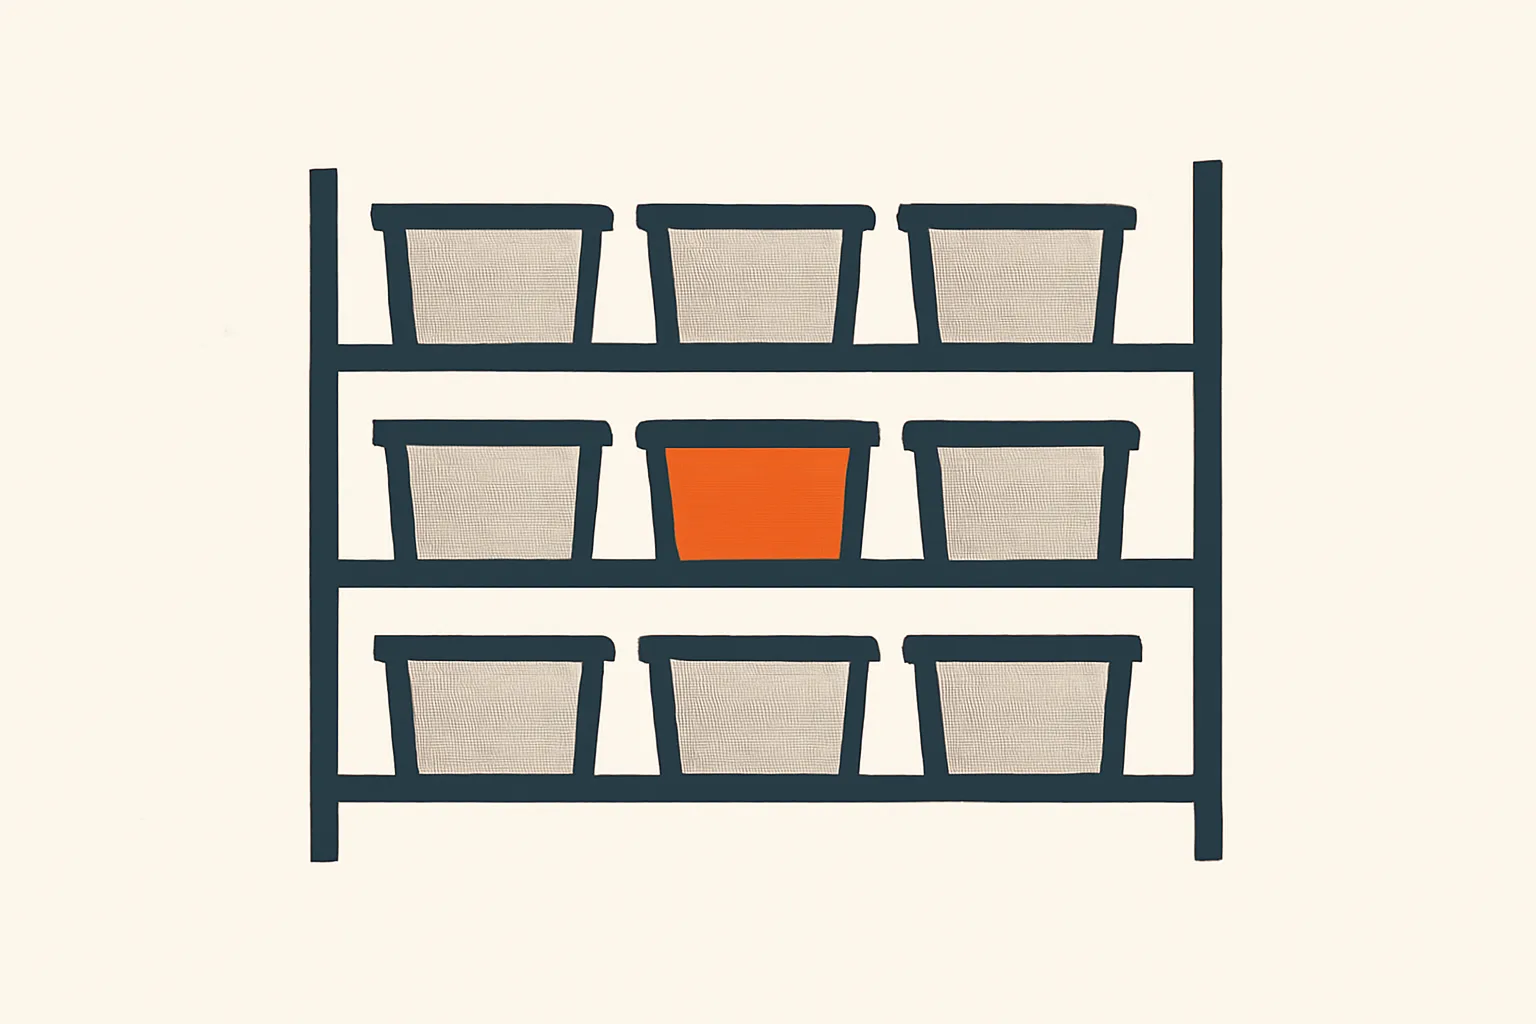
Both reactions miss the point. Ninety-two percent is not a measurement of your inventory. It is an average of thousands of measurements, and the average hides the only thing that decides what it costs you: where the errors sit.
The arithmetic itself is simple. If you count 1,000 SKUs and 920 match the system, you are at 92 percent. Eighty records are wrong. The question nobody on page one asks is which eighty.
Two businesses hiding inside one percentage
Picture two retailers, both at 92 percent.
The first has its errors concentrated in slow-moving backstock. Seasonal overflow, discontinued colourways, the case of hardware that sells twice a year. The system says eleven, the shelf holds nine. It barely matters. Nobody is waiting on those units, the reorder point rarely fires, and the next count will catch it.
The second has its errors concentrated in its top hundred SKUs. The items that turn weekly, sit in every promotion, and drive most of the revenue. The system says four, the shelf holds zero. That retailer is not running at 92 percent in any sense a customer would recognise. It is running a stockout machine with a respectable headline figure.
Same dashboard. Completely different businesses. And the second pattern is not a hypothetical edge case. It is the default.
Why the errors land on the items that matter
The best evidence here does not come from vendors. It comes from researchers who went into stores and counted.
Nicole DeHoratius and Ananth Raman examined close to 370,000 inventory records across 37 stores of a single retailer. Sixty-five percent of them were wrong. The average gap between the record and the shelf was five units, or 35 percent of what was actually there. More useful than the headline was what drove the errors. Annual selling quantity was one of the strongest predictors. The more an item sells, the more transactions touch it, and every transaction is a chance for the record to drift: a mis-scan at the register, a receipt keyed against the wrong line, a return put back without being booked.
In other words, inaccuracy is not spread evenly. It concentrates exactly where velocity is highest, which is exactly where you can least afford it.
ECR Retail Loss, an industry research group rather than a software seller, later ran a larger study across roughly a million SKUs in 100 stores at seven European retailers. About 60 percent of SKUs carried a discrepancy, with individual retailers ranging from 6 percent to 73 percent. Correcting the records lifted sales by an average of nearly 6 percent. The uplift was largest on high-discrepancy, fast-moving items, and the researchers' own recommendation was to point counting effort at that small group, because it is a low number of items with a very high impact on sales.
That is the whole argument in one sentence from people with no hardware to sell.
What a wrong count feeds
The stockout is the visible cost. The less visible one is what happens upstream of the shelf, because your on-hand number is not just a number. It is an input.
By the time a retailer has grown past a handful of stores, several systems trust that count without asking:
- The reorder point. If the system believes four units are on the shelf, it will not reorder until they sell. They never sell, because they do not exist. The item goes out of stock and stays there, and replenishment sees nothing wrong.
- Ship-from-store routing. The order management system picks the store that appears to have the item. The associate walks to an empty peg, cancels, and the order reroutes or dies.
- Pickup availability. The product page promises the item is ready at your nearest location. The customer drives over. We have written before about the back-office team that absorbs these mismatches every night by hand. Bad counts are a large part of what they are reconciling.
- Forecasting. A model trained on sales that could not happen, because the stock was phantom, learns that demand for your best item is lower than it is.
Each of those systems is working correctly. It is doing precisely what it was told with the number it was given. This is why accuracy problems so often get misdiagnosed as software problems, and why retailers end up replacing a replenishment tool that was never the fault.
This is the general shape of the problem. Which parts apply to your process depends on answers only your systems can give.
Put us on it, from $5,000Why "get to 99" is the wrong goal
The standard advice is to raise the number. Practitioner guides put a workable floor at 97 percent and point at large companies averaging well above 99. Those targets are not wrong. They are just aimed at the average, and the average is the thing that was hiding the problem in the first place.
A retailer that drives blended accuracy from 92 to 96 by tidying its backstock has improved the dashboard and changed almost nothing a customer experiences. A retailer that stays at 92 overall but gets its top-velocity items close to perfect has fixed most of what was costing it money.
This is why the cheapest improvement is usually not a new system. It is a different counting policy. Count everything twice a year and you spend enormous labour recounting items that were fine, while your fast movers drift for six months between checks. Count your A items weekly and your C items once a year and you spend less total labour, concentrated where the errors are actually generated. A retailer doing the second usually beats one doing the first on every measure that matters, and it is cheaper to run. We would call that a count worth counting on, and then apologise.
The practitioner instinct already points this way. Some of the bluntest material on the subject comes from warehouse operators arguing that the KPI is the wrong target and the counting process is the real defect. They are right. What nobody has connected it to is concentration: the process should be designed around where the errors land, not around the percentage.
The questions that decide it
Before you buy RFID, a new inventory platform, or a counting service, you need answers to a short list of questions most retailers have never asked of their own data.
Which SKUs is your error concentrated in, by velocity and by value? Most retailers can produce a blended accuracy figure. Very few can produce accuracy by class, and that split is the actual diagnosis.
What does each of those SKUs feed? An item that sits only in-store is one problem. An item eligible for pickup, ship-from-store, and automated replenishment is three problems wearing one barcode.
Where does the drift enter? Receiving, returns, the register, transfers between stores, and shrink each produce a different error signature. The fix for bad receiving is not the fix for theft, and both look identical in a count variance.
And what is your counting policy today, versus what your velocity says it should be? If the answer is "everything, on the same schedule," you already know where the first gain is.
None of these require software to answer. They require someone to sit with your count history and your sales data long enough to see the shape. That is also the honest test for any vendor who wants to sell you an accuracy fix: ask them to tell you which of your items the fix is for. If the answer is "all of them," they are selling to your average. We cover how to run that kind of conversation in our guide to evaluating vendors, and why the value case has to start from your own numbers in how we calculate automation ROI.
What it actually costs
So what does 92 percent cost? It depends almost entirely on which 8 percent is wrong.
If the errors live in backstock, possibly very little, and money spent chasing a higher headline number is money you did not need to spend. If they live in your fastest items, the independent research suggests the cost shows up as lost sales in the mid single digits, plus a set of downstream systems quietly making bad decisions on your behalf, plus a back office cleaning up after them.
The number on the dashboard cannot tell you which retailer you are. The count history can.
If your accuracy figure looks acceptable and your stockouts, cancelled pickups, and replenishment misses say otherwise, the gap between those two stories is usually where the problem lives. Talk to us and we will find out which of your items the error sits in, and what it is feeding, before you buy anything to fix it.